
Customize your map with custom layers using Mapbox SDK on Android

1. Introduction
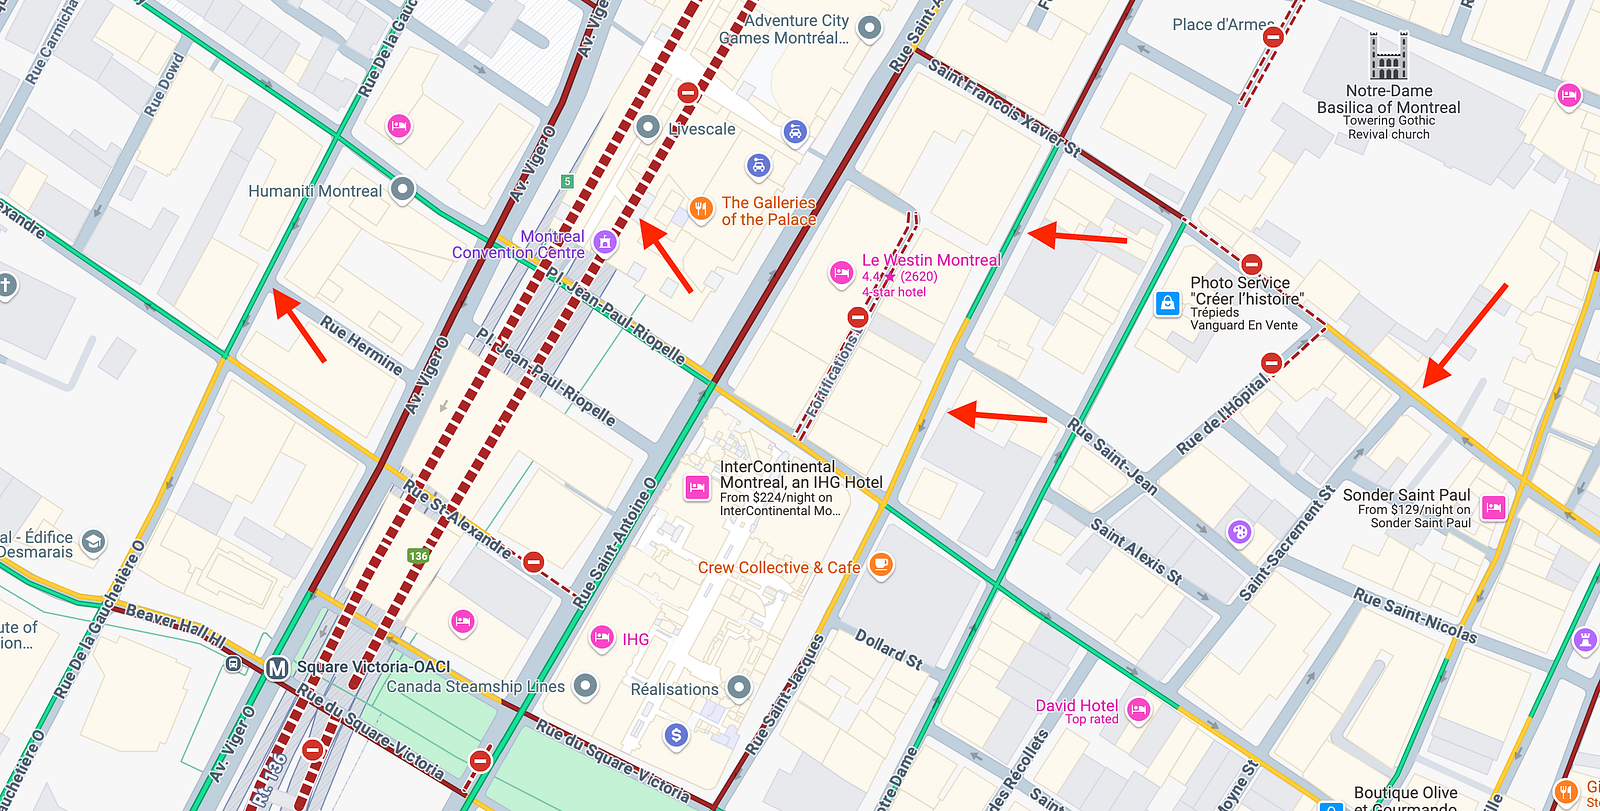
When you use a map application, there is certain information that you can decide to show or hide on your map according to your needs, this information can be for example the traffic in case you want to have an idea about the traffic of a road you want to take, as on this map (Figure 1) there are zones on the road having a color that can be red to say that the traffic is very slow, yellow to say that the traffic is slow and green for a normal traffic.
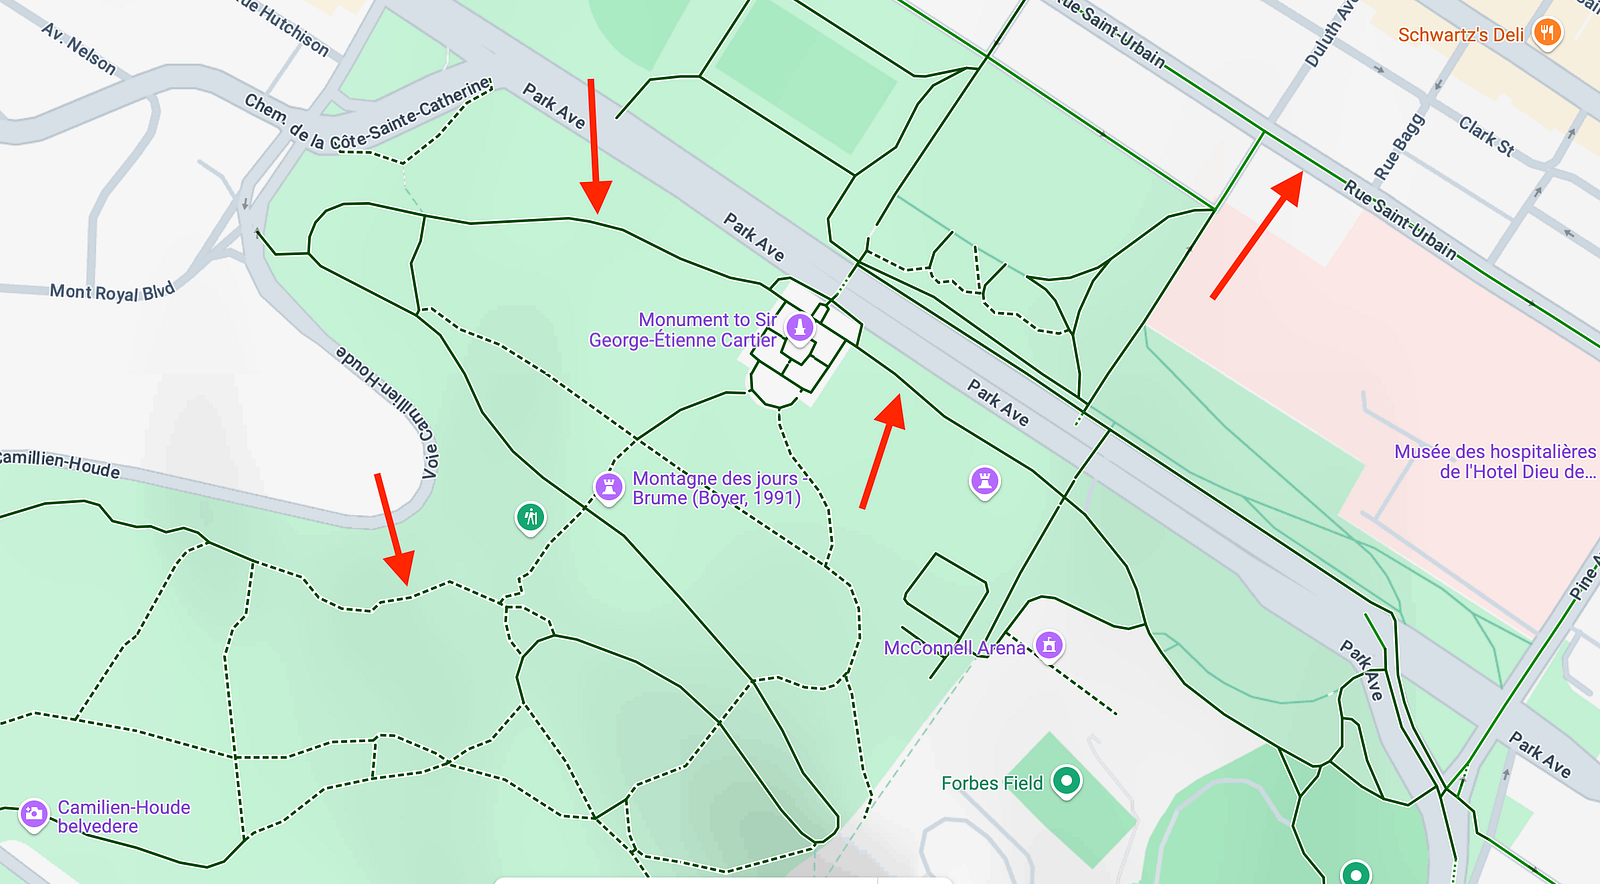
Or like this one (Figure 2), the dark green lines show roads with bike lanes.
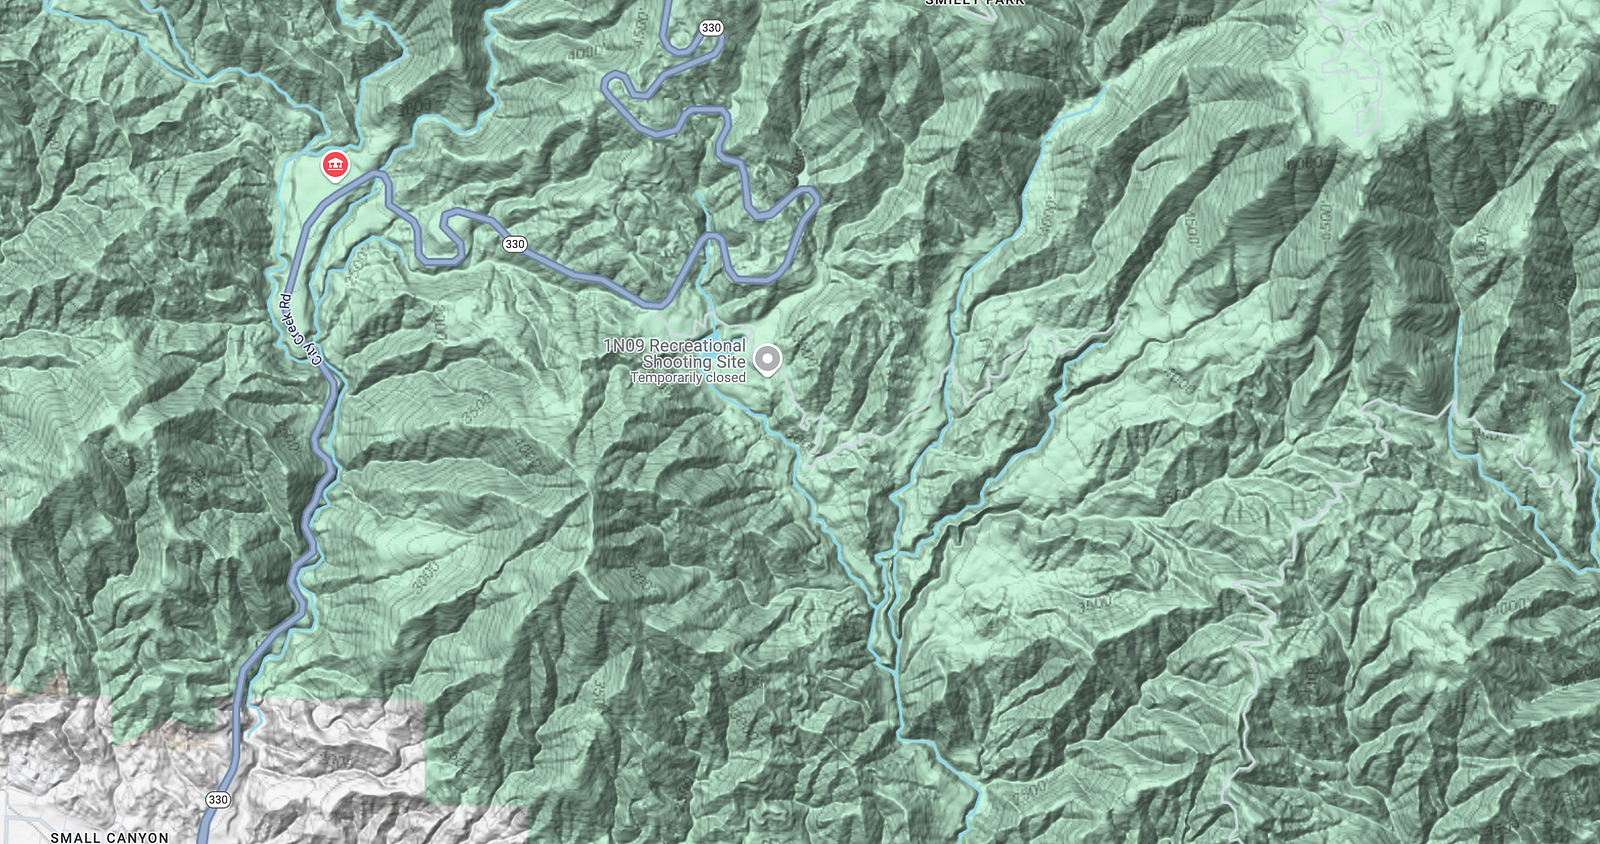
Or as on this map (Figure 3), where you can see the topology or elevation of different locations
All this information is added to the map in the form of layers, which is what we’ll learn to do in this article using the mapbox SDK.
1.1. What’s a layer
A layer is a visual component that defines how data from a specific source is rendered on a map. Layers allow you to add, style, and manage different types of information on the map, such as roads, terrain, buildings, or custom data like bike paths or points of interest.
1.2. Key Concepts of a Layer
a. Data Source :
Each layer is tied to a data source, which could be vector data (GeoJSON, tilesets) or raster data (images or elevation models like Figure 3).
b. Layer Type :
Layers determine how data is visually represented. Common types include:
- Fill: Used for polygons (e.g., areas on the map like parks or regions).
- Line: Used for paths or borders (e.g., roads, trails).
- Circle: Used for points (e.g., cities, landmarks).
- Symbol: Used for icons or labels.
- Raster: Used for images like satellite or terrain data.
1.3. Style and Behavior :
Each layer can have its own styling options, such as color, width, opacity, and interactivity. Layers are also rendered in a specific order (higher layers overlap lower ones).
1.4. How Layers Work
1. Input Data: A layer gets its data from a source, such as GeoJSON, vector tiles, or raster images.
2. Visualization Rules: A layer applies rendering rules to the data, such as line thickness or polygon fill color.
3. Interactivity: You can define interactivity, like hovering or clicking on a layer, to display additional information or trigger actions.
1.5. Use Cases for Layers
- Topographic Information: Adding contour lines or elevation shading.
- Road Data: Highlighting specific types of roads or bike paths.
- Custom Data: Visualizing points of interest or administrative boundaries.
- Imagery: Overlaying satellite images or heatmaps.
1.6. Comparison to Other Concepts
- Source: Provides raw data (e.g., a GeoJSON file or raster image).
- Layer: Defines how the source data appears on the map.
- Style: A collection of layers that define the overall appearance of the map.
2. Configuration
Now that we’ve understood what a layer is and how it works, it’s time to see how to add layers to our map with Mapbox, but to do this we need to add Mapbox dependencies, and for our demo application we’ll need two dependencies in our app/build.gradle file
dependencies {
    implementation("com.mapbox.maps:android:11.7.1")
    implementation("com.mapbox.extension:maps-compose:11.7.1")
}
For Android Studio to be able to download dependencies you should have a Mapbox token that you need to add to our project in the strings.xml file, and to get this token you should create a Mapbox account and follow the steps on this link.
<resources xmlns:tools="http://schemas.android.com/tools">
    <string name="app_name">mapbox-layer</string>
    <string name="mapbox_access_token">your-token-mapbox</string>
</resources>
And after having the token, setup the maven repository in the settings.gradle file like this and then sync the project.
dependencyResolutionManagement {
    repositoriesMode.set(RepositoriesMode.FAIL_ON_PROJECT_REPOS)
    repositories {
        google()
        mavenCentral()
        maven {
            url = uri("https://api.mapbox.com/downloads/v2/releases/maven")
        }
    }
}
3. Add your first custom layer
Before adding a layer to the map, you need to know what type of data will be associated with the layer, so you know what type of layer to use.
3.1. Vector data
In this example I would like to display on the map all the bike paths of the city of toronto, and the data of all the bike paths of the city can be found on the website of the city of toronto on the following link
Vector data often comes in a GeoJSON file. A GeoJSON file is a file format based on JSON (JavaScript Object Notation), specially designed to represent geographic data. It is commonly used to store spatial information, such as points, lines and polygons, and their associated properties.
And since a bike path is just several lines from point A to point B etc, that’s why when you download the data for Toronto’s bike paths, they come in GeoJSON format as you can see in the download section.
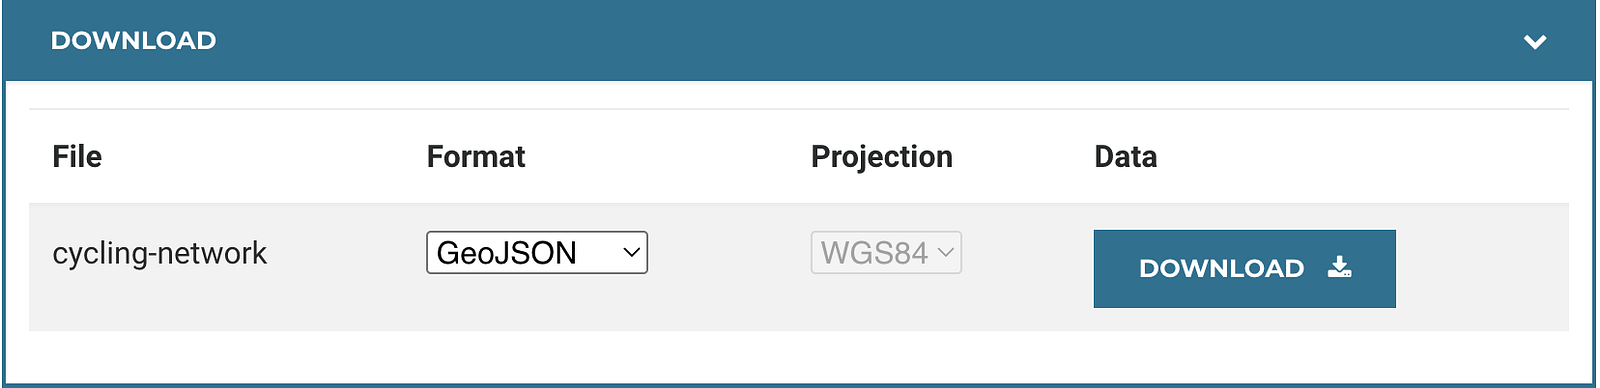
Note : Other file formats are available, but for this article we’ll only explore the GeoJSON format.
3.2. Display Vector data
Since we know that the data source is a vector representing paths, we can use a LineLayer. To do this, start by displaying a base map as follows
public class MainActivity : ComponentActivity() {
  override fun onCreate(savedInstanceState: Bundle?) {
    super.onCreate(savedInstanceState)
    setContent {
      val mapViewportState = rememberMapViewportState {
        setCameraOptions {
          zoom(2.0)
          center(Point.fromLngLat(-98.0, 39.5))
          pitch(0.0)
          bearing(0.0)
        }
      }

      // The map
      MapboxMap(
        modifier = Modifier.fillMaxSize(),
        mapViewportState = mapViewportState,
        content = {
            // Put your layer here
        }
      )
    }
  }
}
a. Create a Layer
To create a line type layer with MapBox, you need to use the LineLayer composable like the following code, passing it the data source, in our case a GeoJSON that we’ve just downloaded and put in the assets folder of our project.
As you can see, we associate the GeoJSON file with the layer using rememberGeoJsonSourceState
@Composable
private fun CyclingNetworkLayer() {
  LineLayer(
    layerId = "pedestrian-network-layer",
    sourceState = rememberGeoJsonSourceState {
      data = GeoJSONData("asset://geojson/cycling-network.geojson")
    },
    init = {
      lineColor = ColorValue(Color.Red)
      lineWidth = DoubleValue(5.0)
    }
  )
}
As I explained above, a layer defines how to display a data source on the map, which is why a layer can have a colour, and in this case if it’s a line layer, you can define the width of the line, and the Mapbox SDK offers plenty of other customization options depending on how you want your layer to be displayed.
The base map that you see before adding a custom layer already has several predefined layers that show us informations such us routes, the delimitation of the borders of different countries etc., which is why when you add a new layer you have to make sure that it has a unique ID because the Mapbox SDK does not allow you to add layers with the same ID.
b. Add a Layer to the Map
To add a Layer to our Map, simply call the CyclingNetworkLayer() composable in the content block of the MapboxMap composable, as shown in the following code.
MapboxMap(
  modifier = Modifier.fillMaxSize(),
  mapViewportState = mapViewportState,
  content = {
    CyclingNetworkLayer()
  }
)
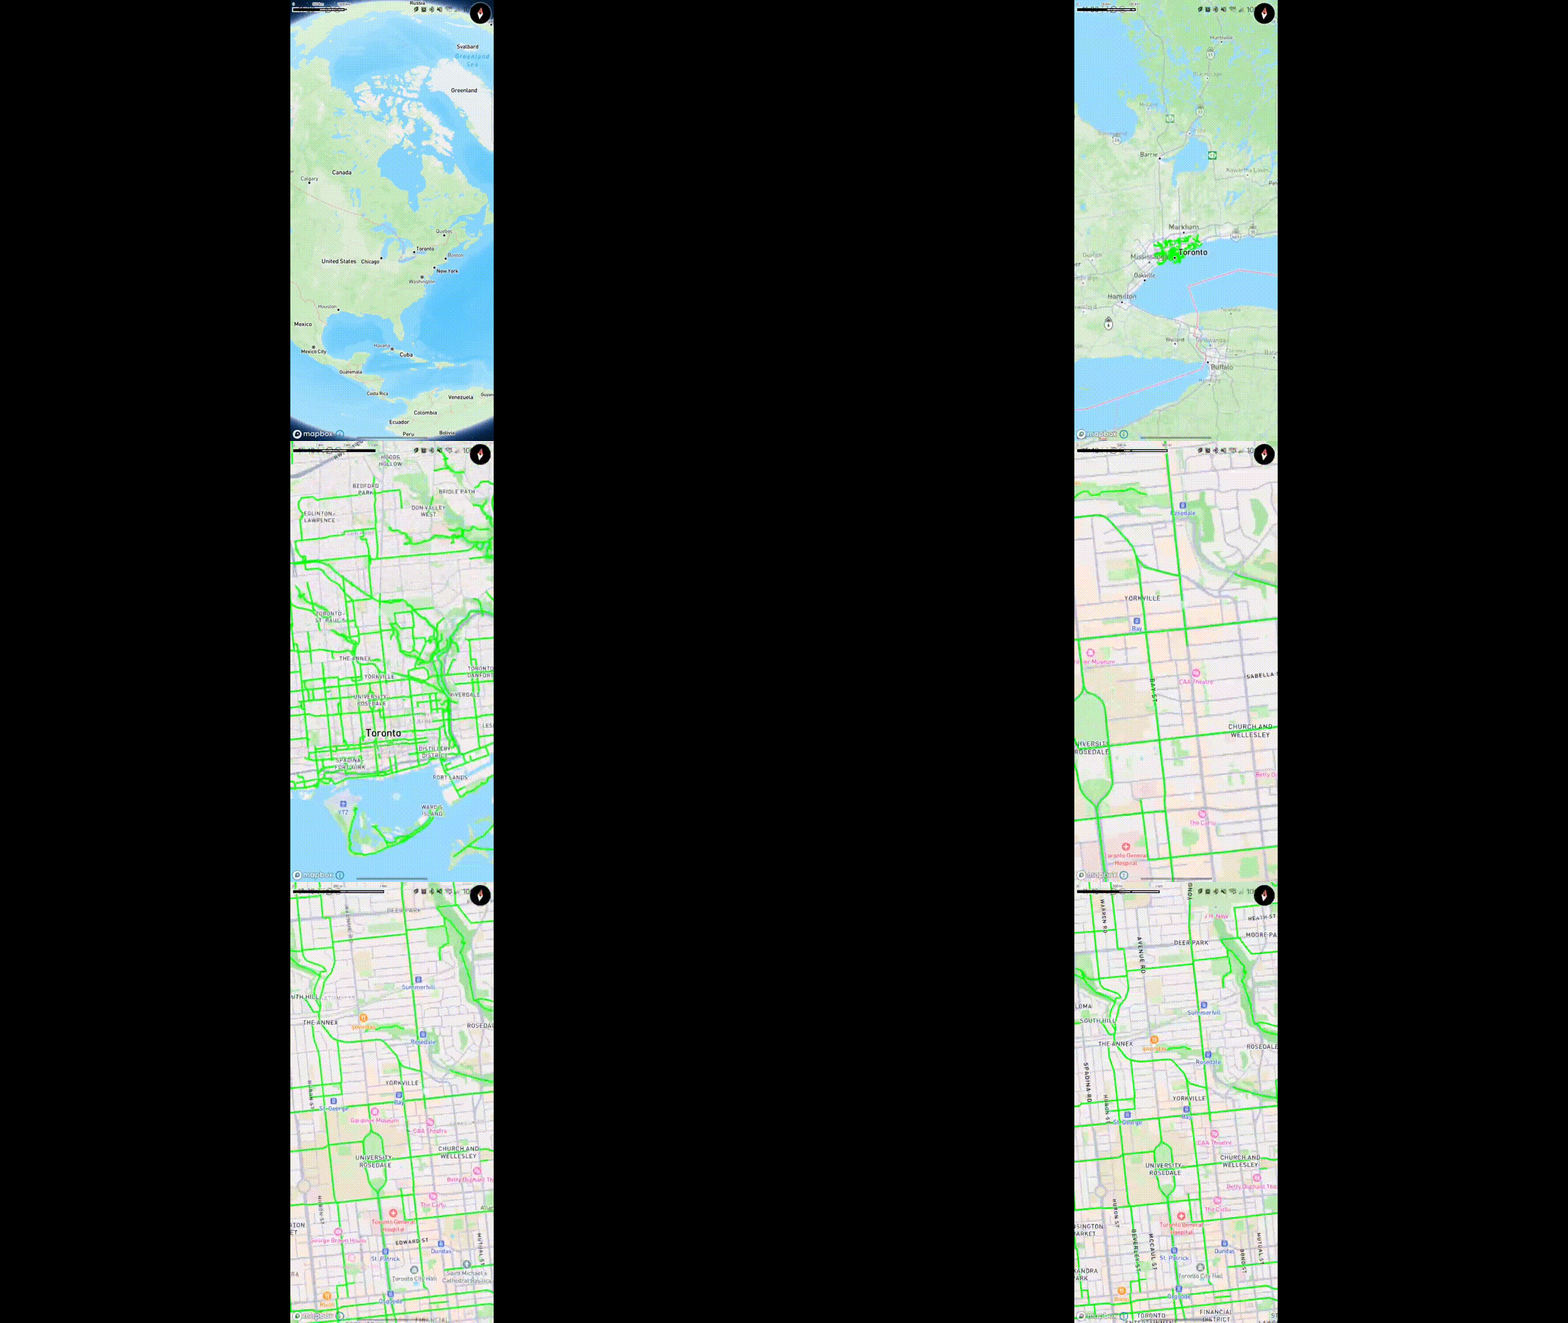
If you run the app and zoom on Toronto you’ll see some green path the represent cycling route like in the following video
c. Add a second Layer
The layer idea is very powerful because you can stack layers on top of each other, and to show you how we’re going to download a GeoJSON that presents the pedestrian routes and we’re going to display the bicycle paths on top.
@Composable
fun PedestrianNetwork() {
  LineLayer(
    layerId = "pedestrian-network-layer",
    sourceState = rememberGeoJsonSourceState {
      data = GeoJSONData("asset://geojson/pedestrian-network.geojson")
    },
    init = {
      lineColor = ColorValue(Color.Red)
      lineWidth = DoubleValue(5.0)
    }
  )
}
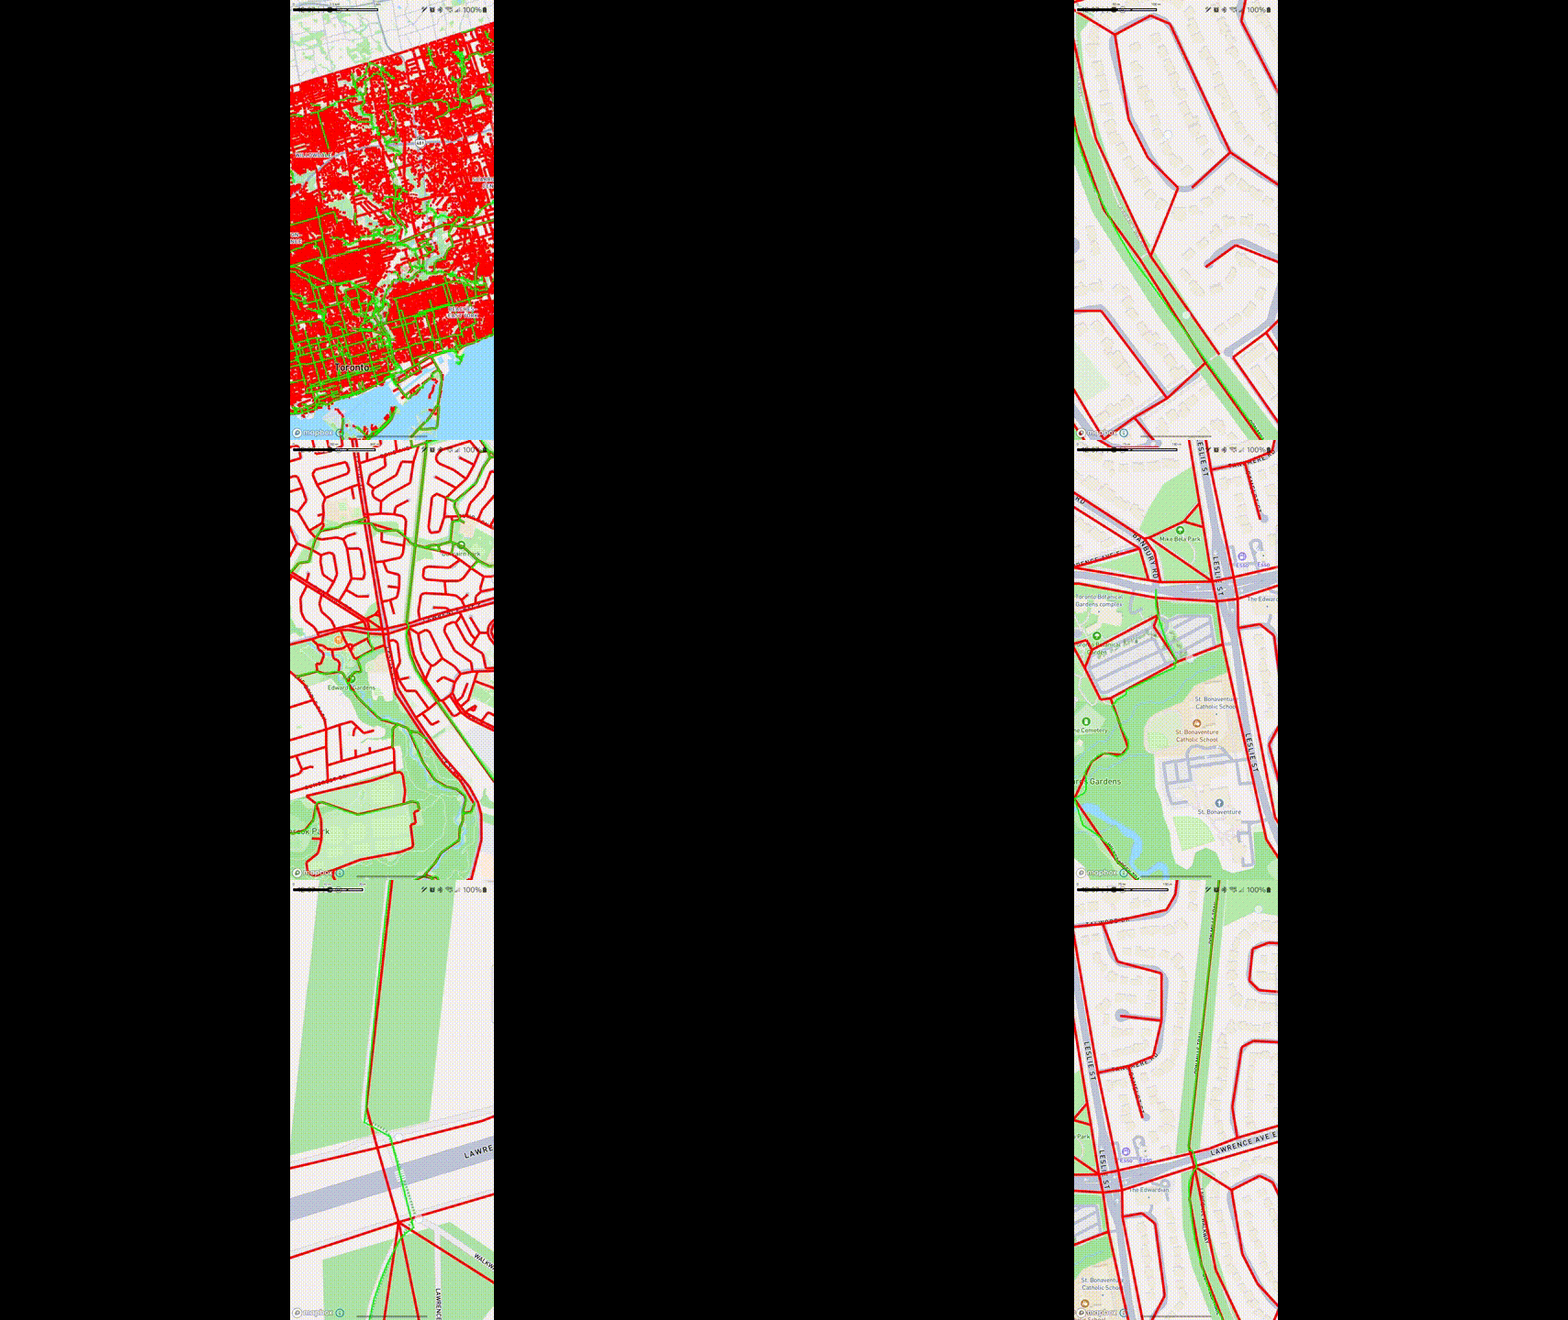
As you can see, the code remains the same, it’s just the data source that’s changed, and as some pedestrian crossings can be confused with cycle paths, we’re going to increase the width of the pedestrian crossing and use a different colour to distinguish the two paths.
And to add this new layer to the map below the cycle paths, we start by adding a PedestrianNetwork and then add the CyclingNetworkLayer as shown in the following code.
MapboxMap(
    modifier = Modifier.fillMaxSize(),
    mapViewportState = mapViewportState,
    content = {
        PedestrianNetwork()
        CyclingNetworkLayer()
    }
)
If run the code you can now see the pedestrian network in red and the cycling network in green
4. Heatmap Layer
Now let’s try to explore another type of layer that can be used with vector data, as the name already suggests, a layer that is often seen in weather applications and that allows you to see the heat level in a given area.
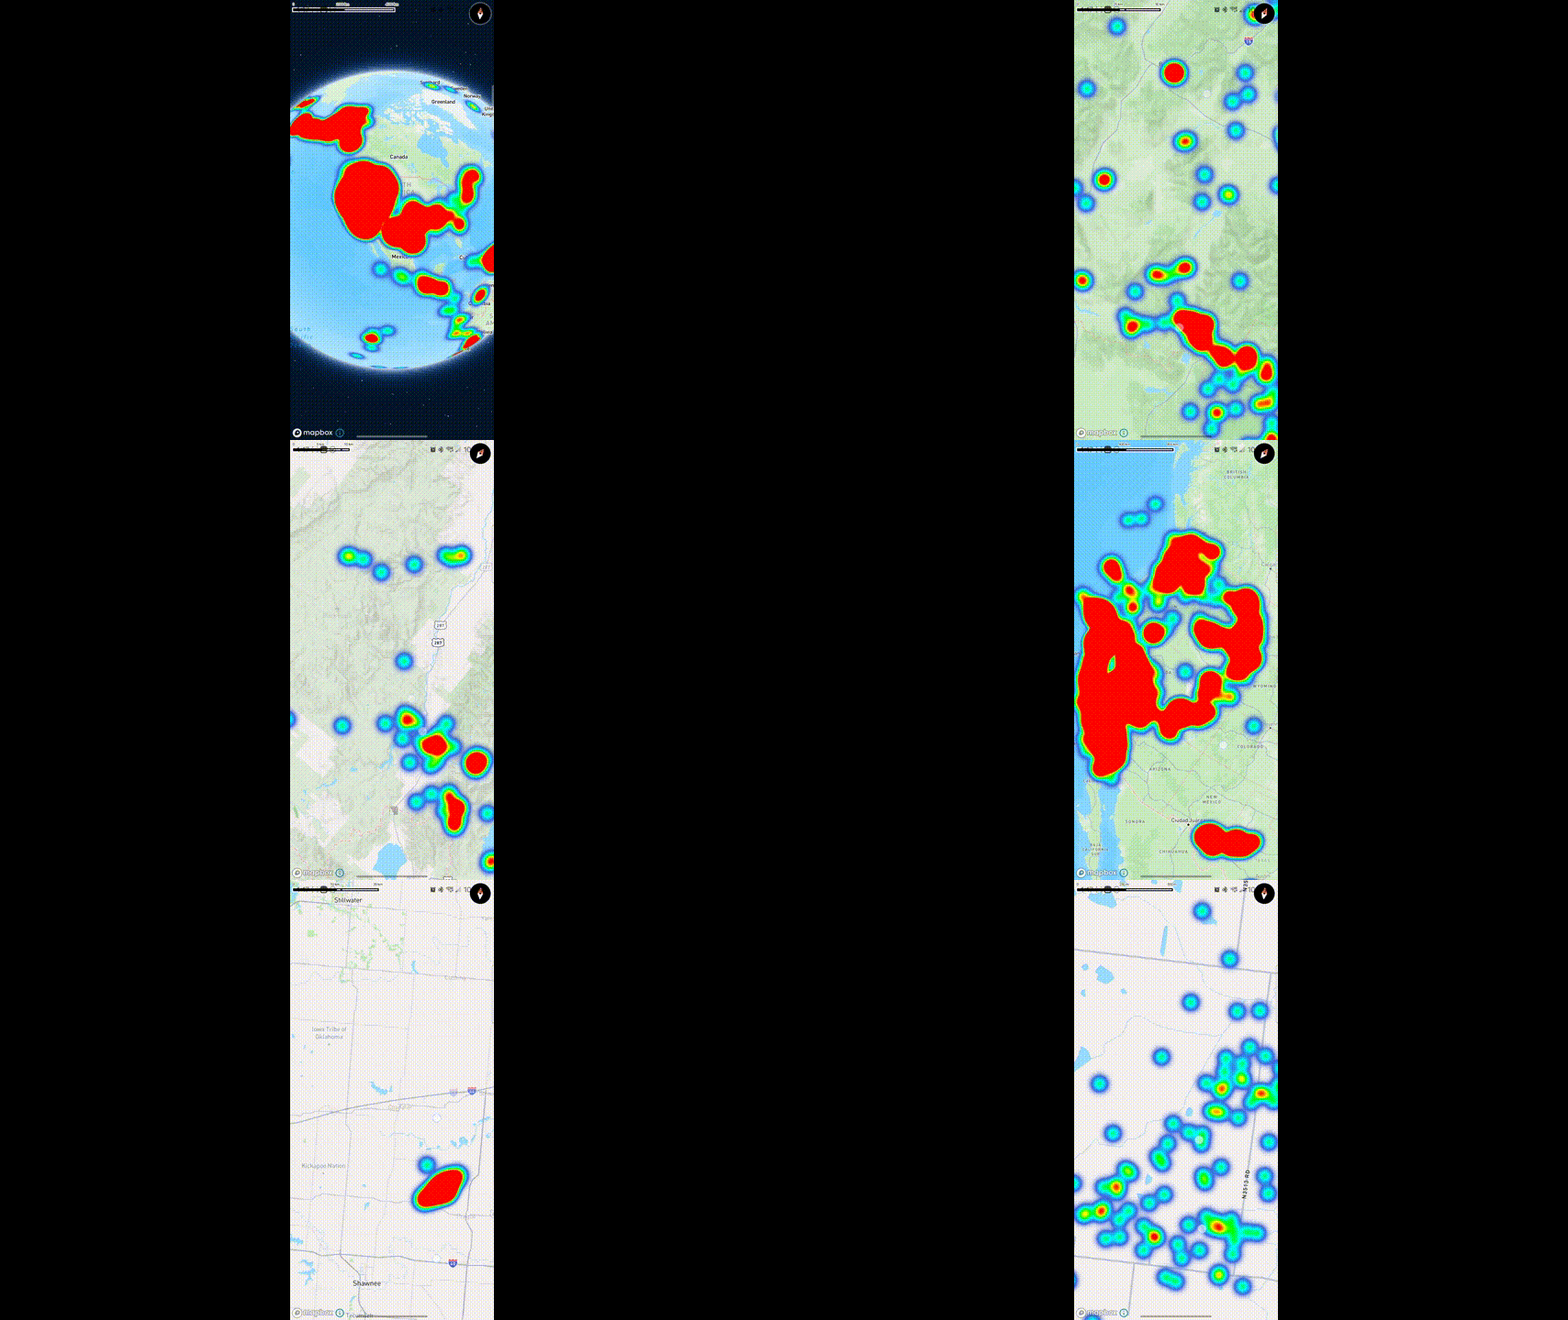
In this example I’m going to use a GeoJSON that contains information about the heat level of the whole earth during a given period, and to display such information we’re going to use the HeatmapLayer composable like the following code
@Composable
fun WorldHeatmapLayer(modifier: Modifier = Modifier) {
    HeatmapLayer(
        layerId = "heatmap",
        sourceState = rememberGeoJsonSourceState {
            data = GeoJSONData("asset://geojson/heatmap.geojson")
        },
    )
}
If you run the application after adding this layer to the map, you will see something like this
5. Summary
The custom layer in MapBox is a very powerful tool that you can use when it comes to adding several types of information on your map, I’ve just shown some very simple cases here but it is quite possible to do more like add other types of layer based on data sources that are not vector or interact with the layers, if you want to know more feel free to read the official documentation and especially feel free to leave me questions or recommendations if there are any.
The link to the sample’s github repository can be found at the following link.
6. Reference